There can be a big payoff for those that are applying Asset Analytics. Those that are doing so effectively are generally experiencing significant Operational benefits. Their Maintenance and Operations teams now have much greater awareness of asset health and performance and can make proactive decisions about when to plan for and schedule asset downtime for corrective maintenance. For those that are considering leveraging a current Asset Analytics platform, you may have the following questions:
To get us started, let’s review the P-F curve and where Asset Analytics fit. The P-F, or Prevention – Failure, curve is a graph commonly used by Maintenance and Reliability Engineers to identify the status of asset health and performance over time. Maintenance and Reliability Engineers use the P-F curve for a variety of reasons including the planning and scheduling of maintenance to extend asset life. There have been great strides in recent years in Asset Performance Management solutions such as AspenTech’s software Aspen Mtell®.
The P-F curve plots the interval between an asset’s potential failure (P₁) and functional failure (F), allowing you to identify which preventive and predictive maintenance measures can be taken to identify and halt progression towards a failure mode. P₁ in the P-F curve represents the point in time when damage starts to occur whereas P₂ represents the point in time when the failure is imminent if the condition is not addressed. F represents the point in time when the asset reaches functional failure and needs to be taken out of service. The P-F interval is the time interval between P₁ and F. Although the below diagram doesn’t indicate this, it is best practice to take the compromised asset out of service before you notice audible noise to prevent further damage to the machine, fire, and safety issues.
Typical Prevention – Failure (P-F) Curve
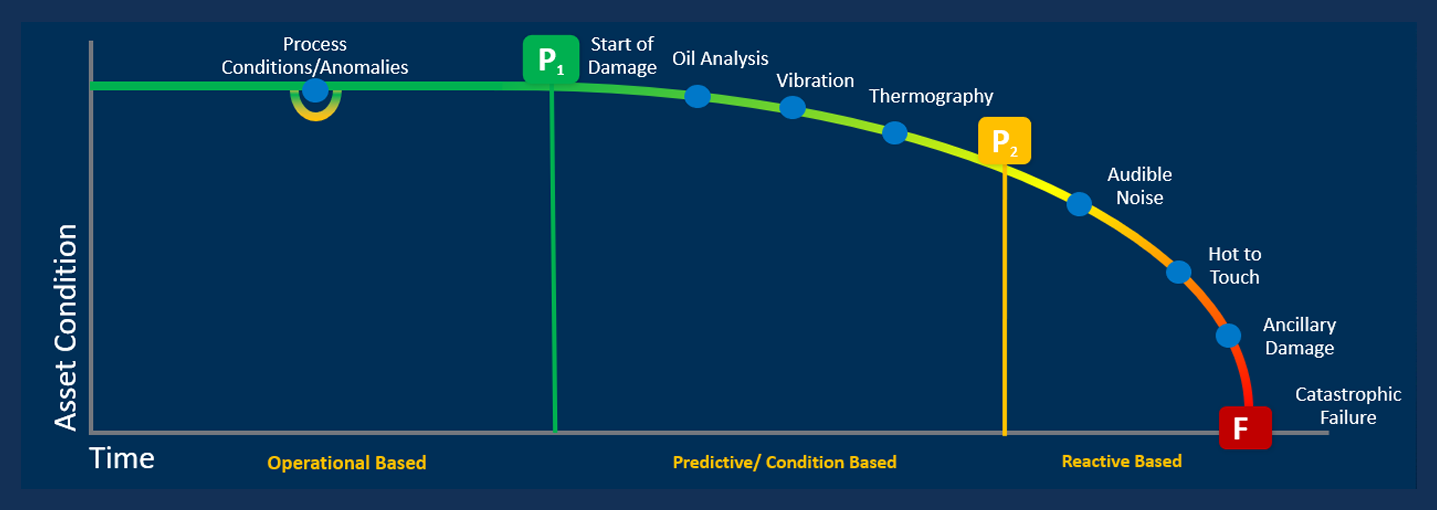
A typical strategy for Reliability Engineers is to use complementary preventative and predictive maintenance strategies to greatly extend the P-F interval of an asset. This can include the use of Oil Analysis, Vibration Analysis and Monitoring, and Thermography as shown in the above diagram but can also include Visual inspections, Time based maintenance, Corrosion monitoring, Acoustics analysis and monitoring, Motor Current Signature Analysis, etc.
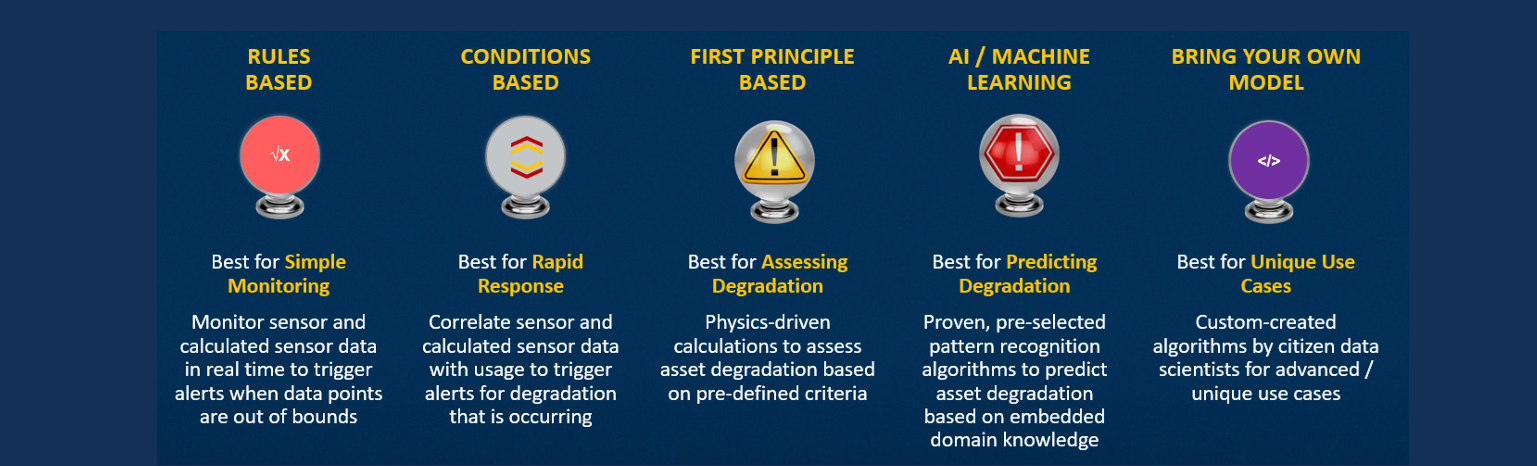
Adding simple (Rules and Conditions Based) alerts is straightforward while the tools for adding First Principle Based, AI, and Machine Learning are now available in a “no code” configurable environment. This makes these tools accessible to and appropriate for the Reliability Engineer.
Furthermore, the AI and Machine Learning models are designed to be simple to manage and update, making it easy for the Reliability Engineer to keep the models current. Also, the analytics tools do account for assets running in different operating regions/states based on changes in machine speed, material viscosity and density, temperature, humidity, etc.
Lastly, today’s platforms do allow for custom algorithms using C#, Python, JavaScript, or your programming language of choice for those that have interest in creating custom solutions. Aspen Mtell allows for the best information to be leveraged to make the best possible decisions. As a result, companies implementing Aspen Mtell typically see reduced maintenance costs from 20% to 30% per year and increase throughput 1-5%.
Aspen Mtell Agent Options
Asset Analytics provide additional awareness as an asset’s health and performance degrades, complementing the traditional Predictive Maintenance tools that are commonly used today. These Analytics tools learn degradation and failure patterns in past sensor data to help predict when those problems will occur in the future.
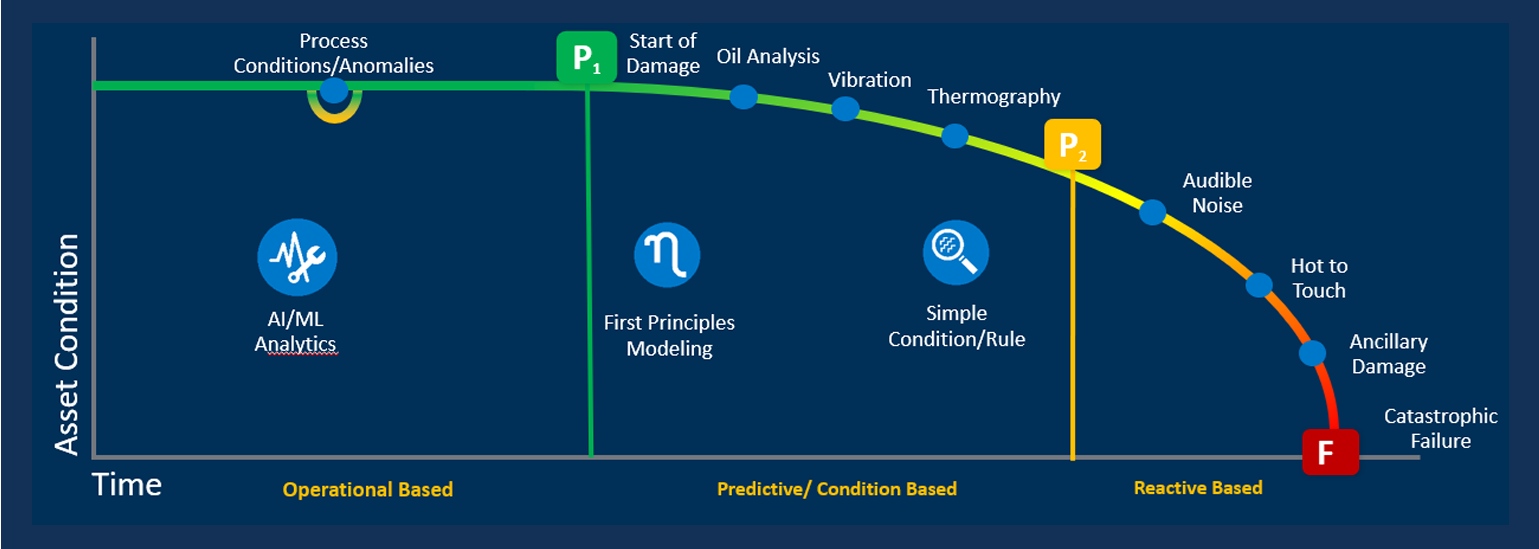
Per the below diagram, the AI and Machine Learning tools allow you to detect anomalies before any damage to the asset occurs whereas First Principles tools can also provide early detection, often before significant damage to an asset has occurred. The combination of AI and first principles models ensure that the guardrails are on the AI. Condition/Rules based monitoring extends the guardrails by making use of data from your Predictive Maintenance and Condition Monitoring tools. In fact, Emerson’s AMS asset monitoring and health analysis solutions have integration points with Aspen Mtell in support of a coordinated approach. The goal ultimately is for timely decision-making, initiating proper planning and scheduling of maintenance to have the least impact on Operations.
P-F Curve inclusive of Mtell Agents
When you are ready to establish your Asset Analytics program, here are some items to consider:
Let the journey and payoff begin! And yes, no data scientists are required.
Jon Hall
Vice President, Digital Transformation
Adatafy™

All images compliments of Aspen Technologies, Inc.